
What did I find?
The Human Development Index (HDI) is a metric used by the United Nations Development Programme. It is determined for a country based on its citizens’ life expectancy, expected and average years of education, per capita Gross National Income (GNI), and was created “to emphasize that people and their capabilities should be the ultimate criteria for assessing the development of a country, not economic growth alone.” I couldn’t agree more. HDI is also among the most difficult topics to discuss, as a conversation involving the Human Development Index requires apologizing and correcting myself about twice a minute for accidentally saying “HDMI.”
In 2019, Bastian Becker created a document called the Colonial Dates Dataset (COLDAT), and graciously uploaded it to the Harvard Dataverse under a Creative Commons license. It’s a useful dataset that compiles the names of countries with the years in which each country was colonized and by whom.
And by now I think you can probably see where this blog post is headed.
What’s in the box?
The HDI dataset compiles the UN’s data for 2021, including a list of 191 countries, their citizens’ life expectancy at birth, expected years of schooling, mean years of schooling, gross national income per capita, human development index, and HDI rank. The HDI rating itself is a floating point number between 0 and 1. For 2021, the values ranged from 0.385 (South Sudan) to 0.962 (Switzerland). HDI rank simply ranks countries by that number, so Switzerland was #1 and South Sudan was #191. The dataset also provides breakdowns by geographic region.
A country will have high HDI (closer to 1) if its citizens have long life expectancy, are highly educated, and if the country has high Gross National Income relative to its population.
Becker’s COLDAT set similarly provides a list of countries. It has columns for eight of history’s most egregious colonizers (Belgium, Britain, France, Germany, Italy, the Netherlands, Portugal, and Spain), and shows what year colonization of each country began and ended, and by which colonial power. Since not all historical sources agree — and as Becker points out, not everyone even agrees whether colonization begins or ends in a single moment with a single event, or whether there is a longer transition — they included columns for mean aggregated dates of the beginnings and endings of colonial periods. I chose to use those mean values.
If you haven’t guessed by now: my hypothesis is that we can smush these datasets together and find some telling correlations.
Caveat Emptor
Neither of these data sets provide every possible datum on their respective subjects. Naturally, that’s impossible. It’s important to be aware of some small holes that I had to leave in my final analysis below. It’s also worth noting that the data that I found still shows what it shows; it would be nice if those holes were filled, but, they also don’t detract from what’s already there.
First, I have omitted all countries that do not appear in both data sets. For several reasons, HDI is not calculated for all countries and the COLDAT set does not contain colonial data for a couple of places that do have an HDI calculation. Therefore, the following are not included in any of my calculations or graphs: Hong Kong, Kosovo, Monaco, Nauru, North Korea (DPRK), Palestine, Somalia, and Taiwan.
Second, not all erstwhile colonial powers appear as colonizers in COLDAT. “Colonization” in this analysis is by necessity defined as “colonization by Belgium, Britain (UK), France, Germany, Italy, Netherlands, Portugal, and/or Spain.” My own country, the United States, has been rightly scrutinized for — among other things — its overseas possessions and ideologies such as Manifest Destiny. It has certainly fit the definition of “colonizer” for large chunks of our history, of which I assume most of you are aware.
With all of that in mind, let’s grab some shovels and start digging.
Is there a relationship between HDI and colonial rule?
Yes, but perhaps not the simple correlation you’d expect going in. Or at least, not the simple correlation that I expected going in. To explain what this data shows, let’s look at some charts. First, here is a chart that plots countries by their 2021 HDI and years spent under colonial rule.
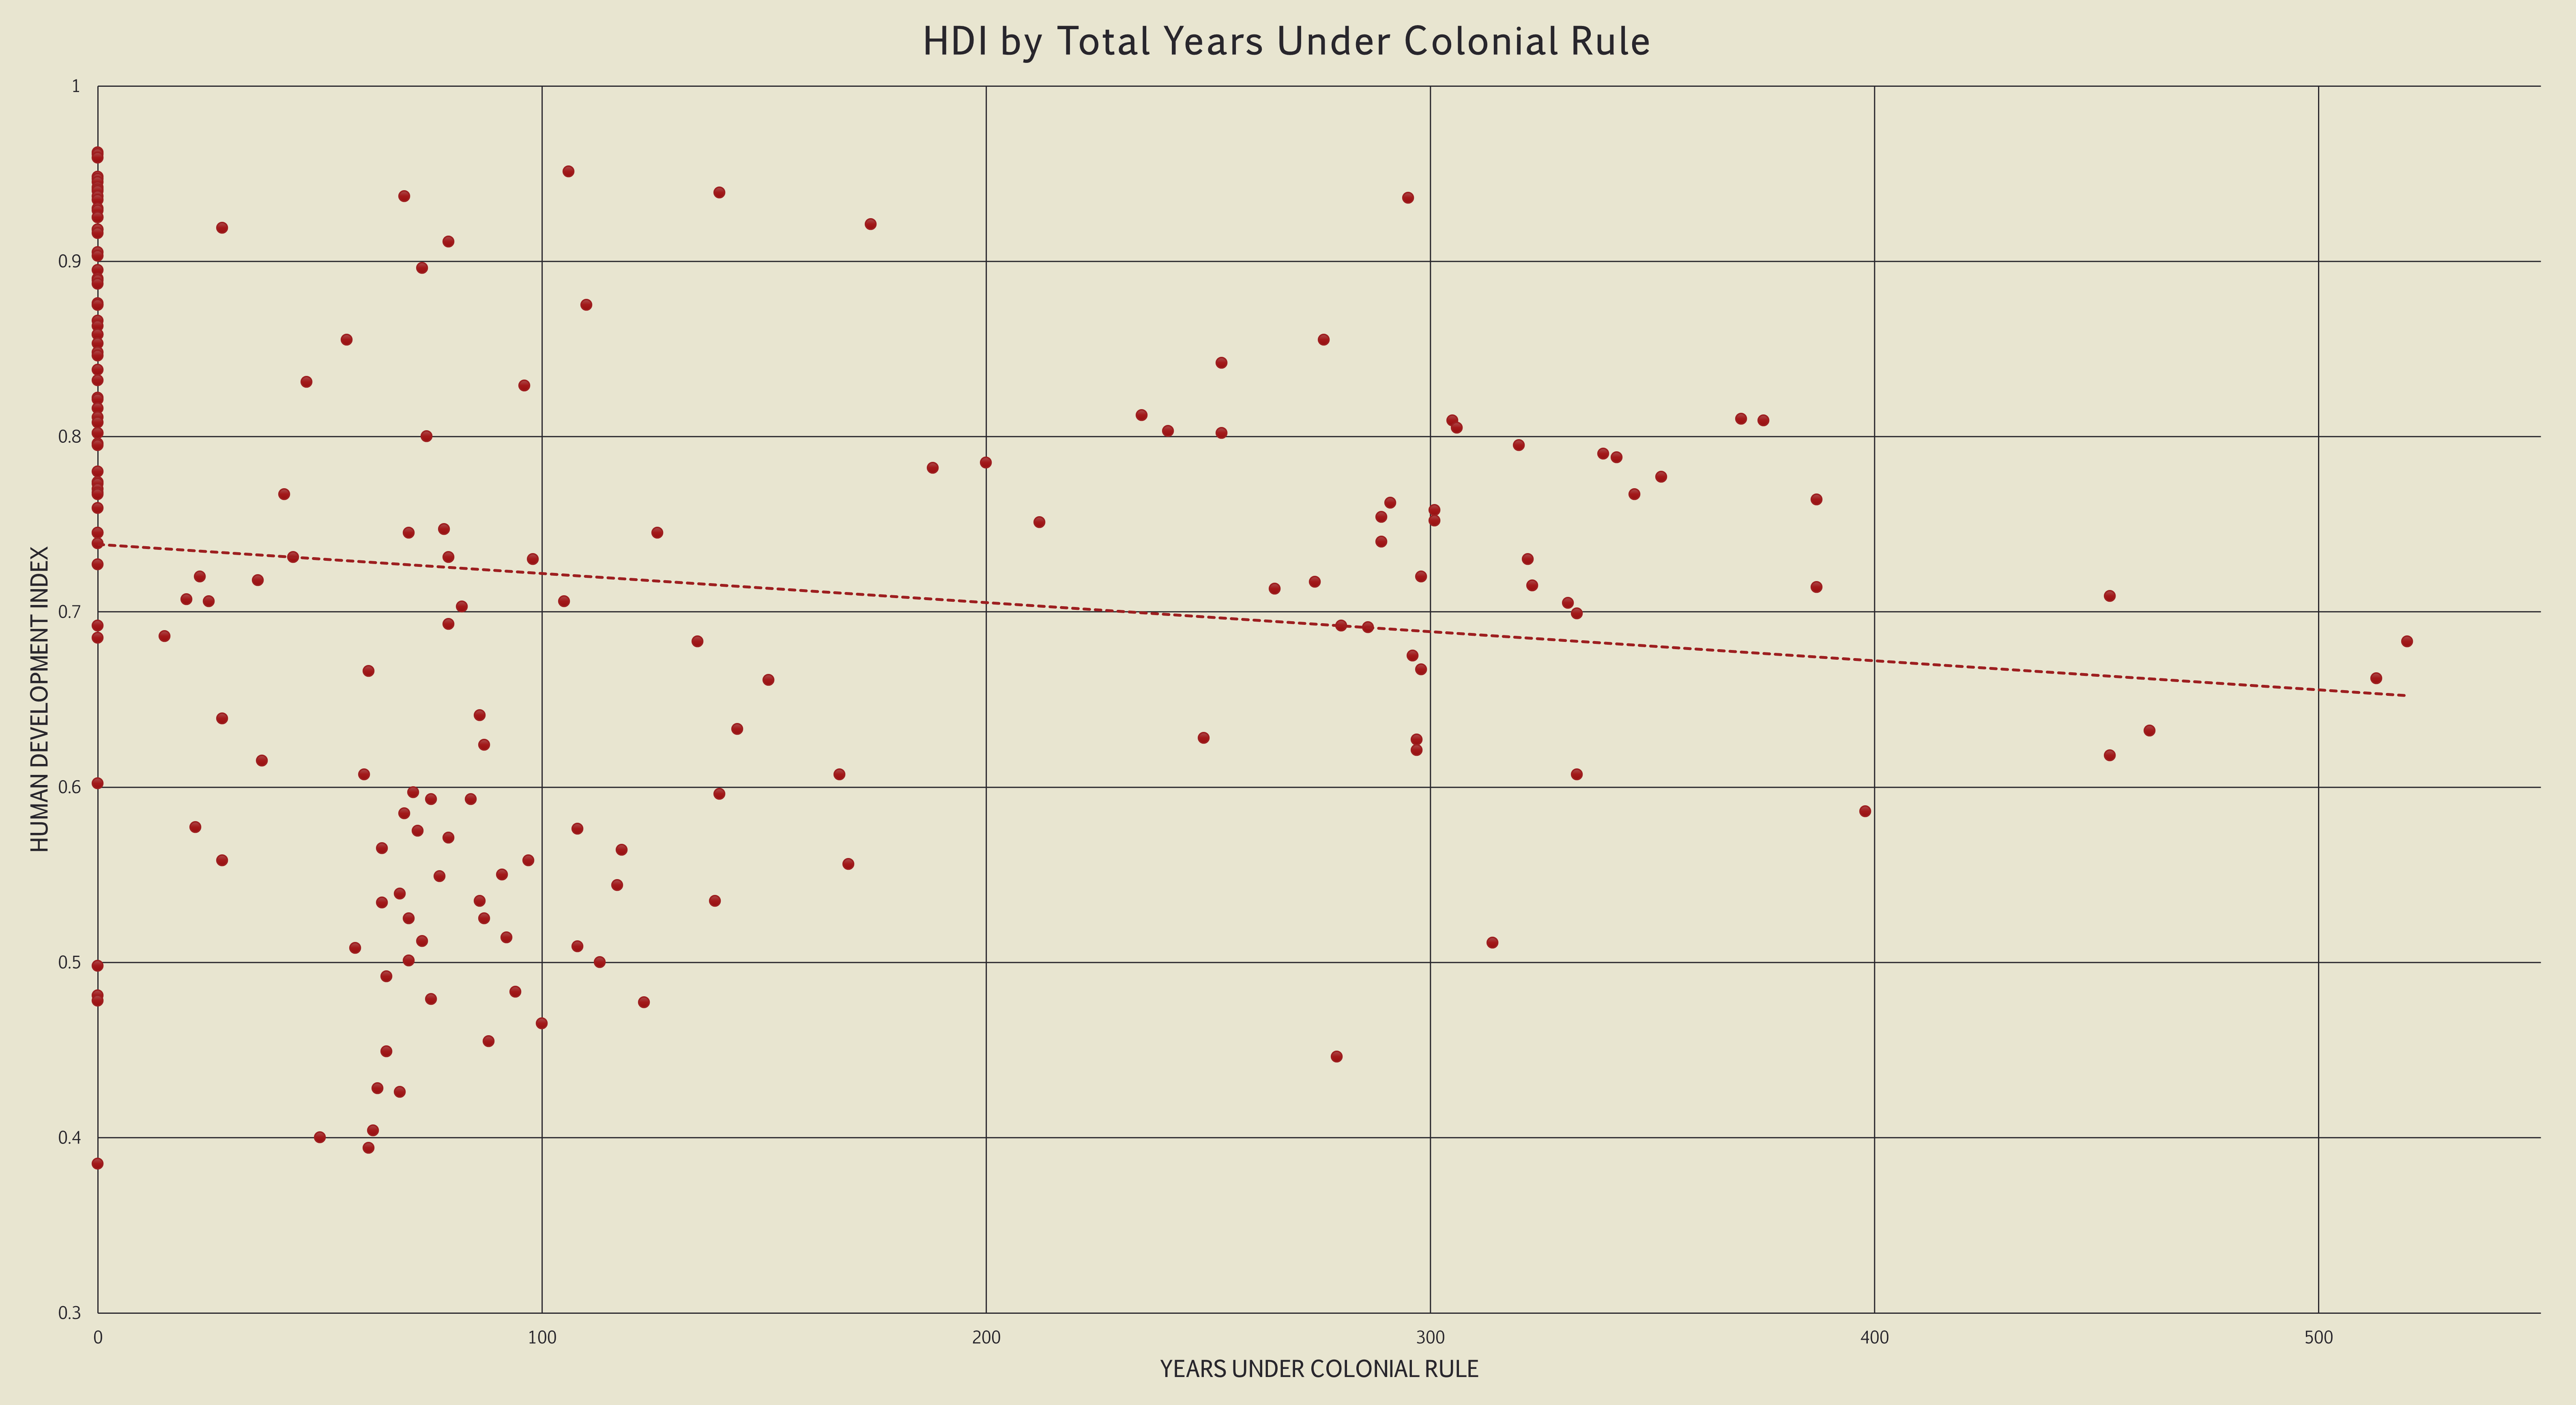
You probably noticed a couple of major details here. First, that the trend line slopes down, showing a negative relationship. That is to say, countries that were ruled by colonists for longer tend to have a lower HDI today. You might also have noticed a stack of points at the far left of the graph — those are countries that were never colonized. Note that most of those 0s occur above the trend line, meaning that they have above average HDI. We’ll be coming back to that later.
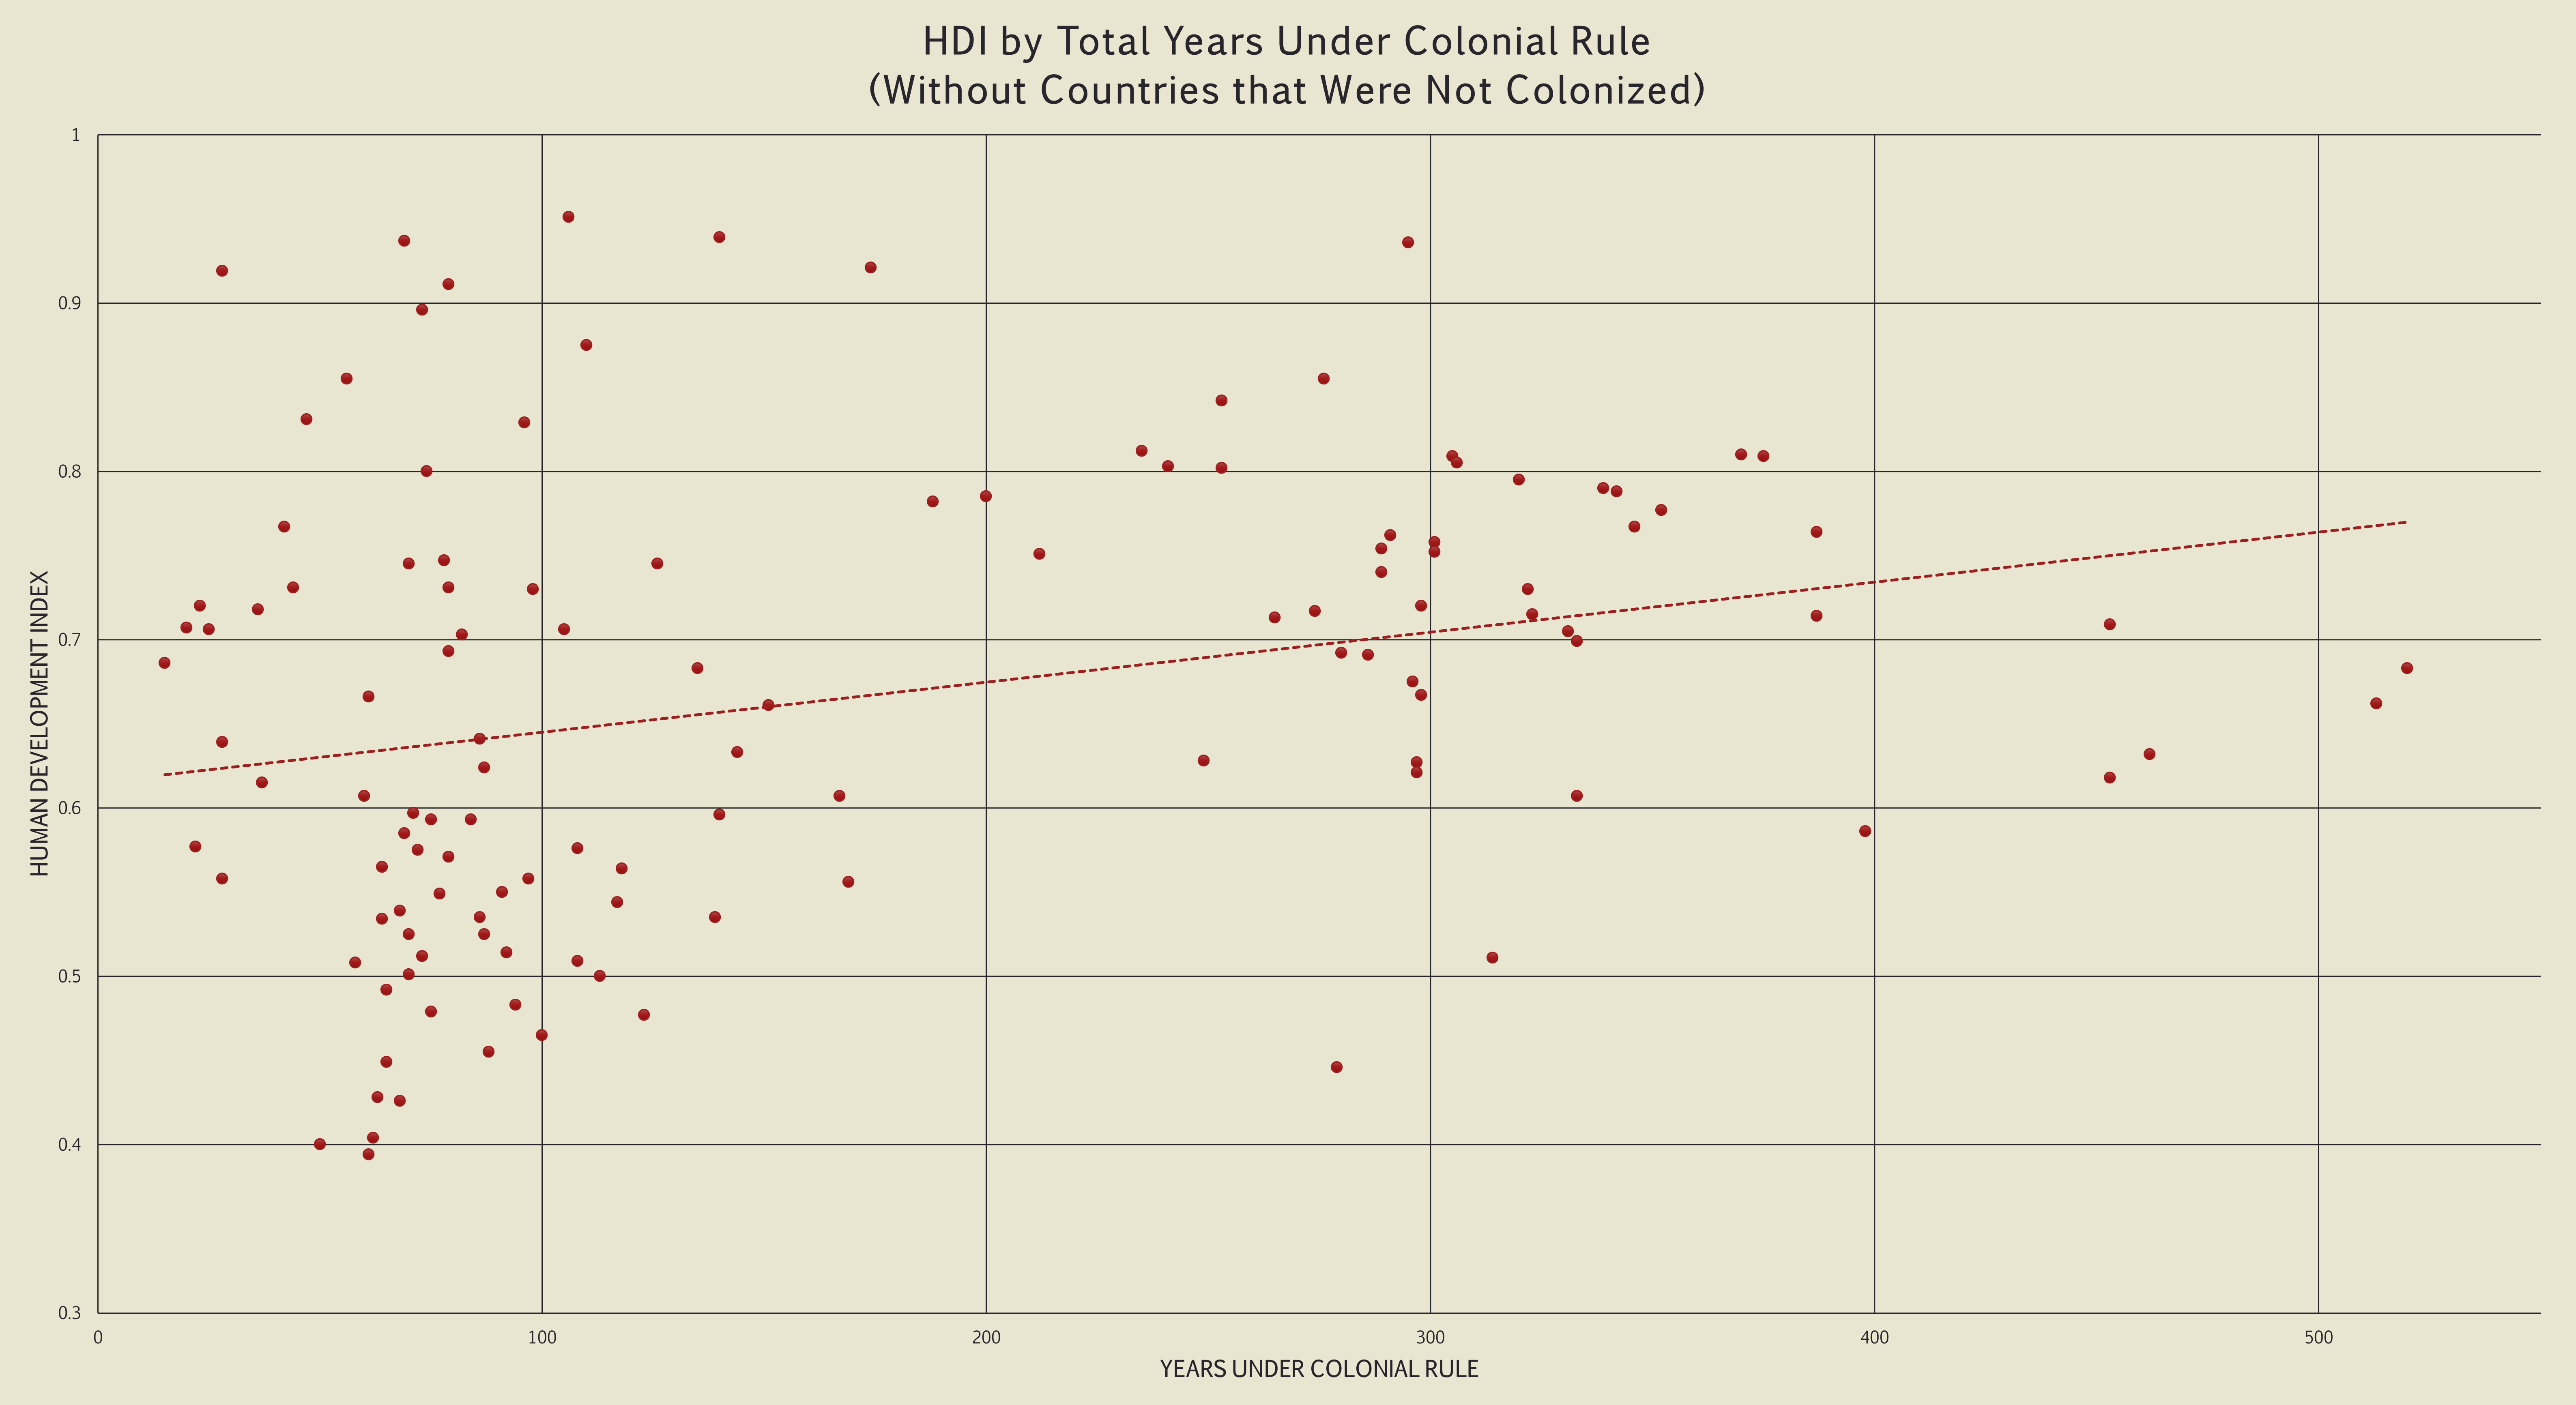
For now, here’s the same chart, omitting countries that did not spend years under colonial rule.
Okay, now hold your horses.
It’s a popular truism that things are not always what they seem. Of course, it’s also popular to add “… to you. Of course this IS the way it seems to ME.” I won’t say that, but I will note that the trend apparent in this chart doesn’t seem to mean a whole lot. Notably, there are countries skewing the trend that were not colonized or only briefly colonized because they are young, there are countries that were dependencies of colonial empires but relatively unaffected or not negatively affected by that status, etc. What we should really learn from this chart is how it changed when we removed something from the previous one. It’s a big deal, and I promise we’ll talk about it soon.
So it seems that total time spent as a colonial possession isn’t the most telling characteristic to examine when comparing it to HDI. Here’s another pair of charts to look at so that we can have a more complete picture of what’s going on.
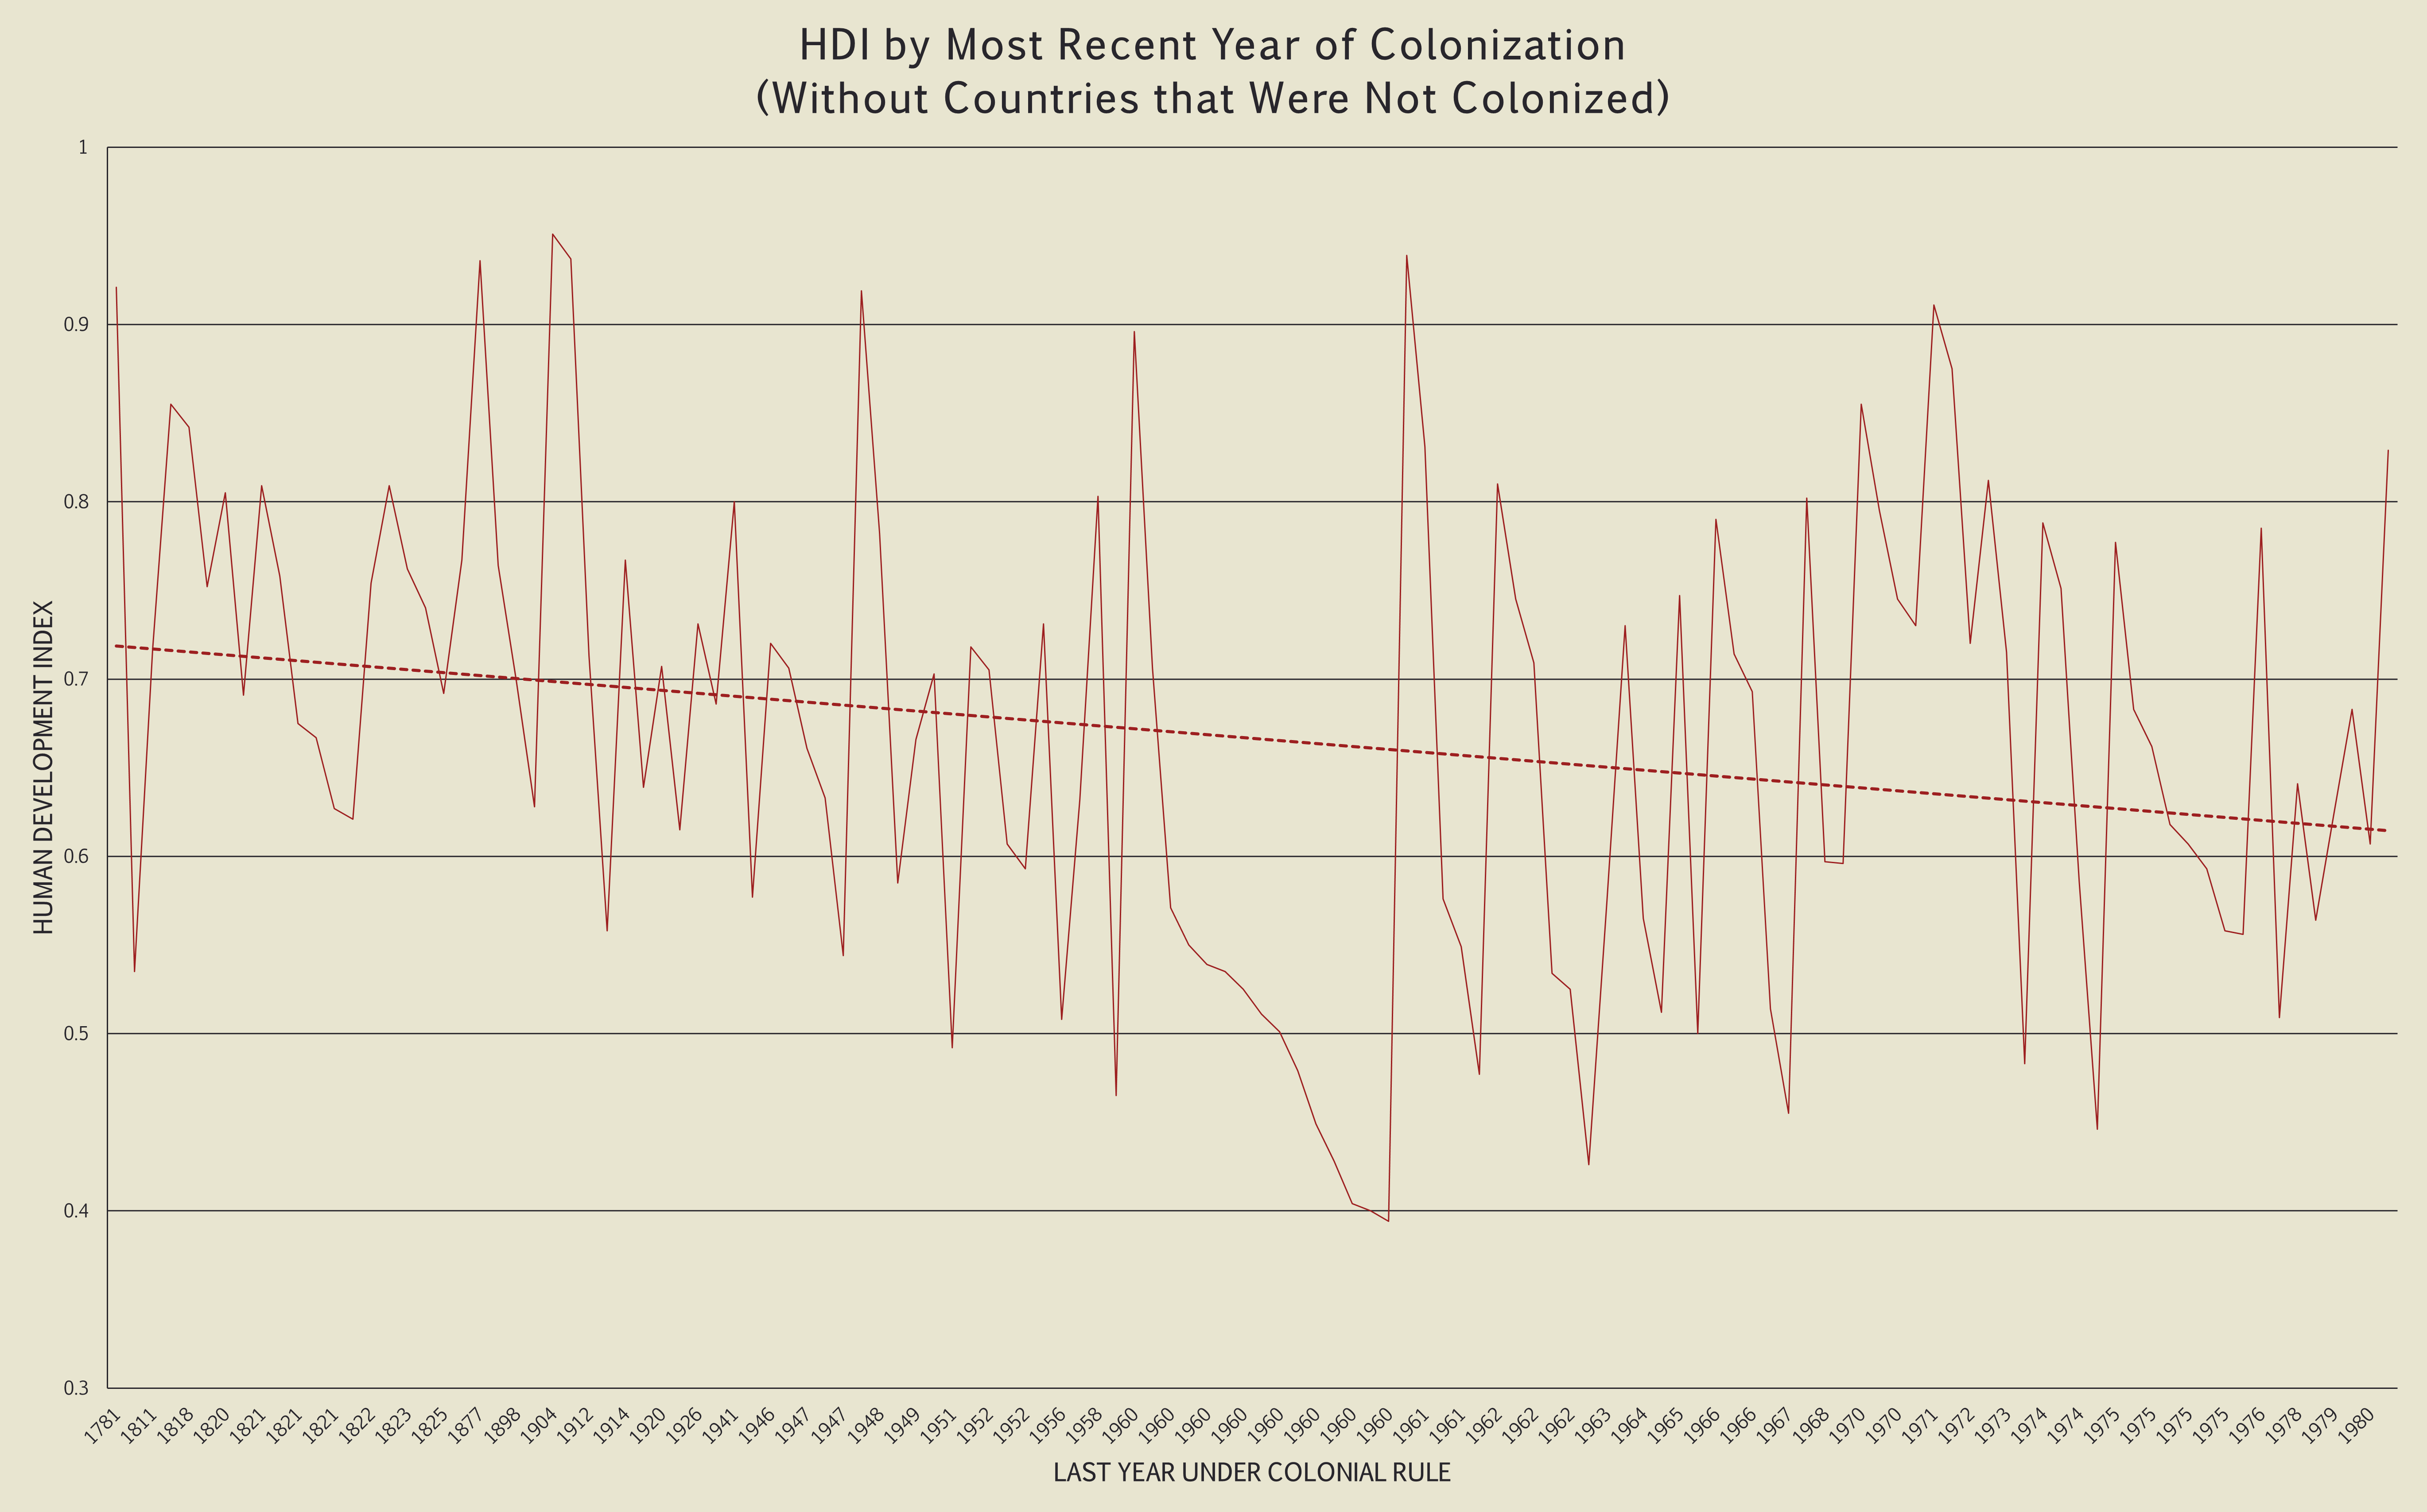
This looks a lot more like what we’d expect to see. It shows that the more recently a country gained independence, the lower its HDI is likely to be. To put it another way, countries that threw off their colonizers earlier are, on average, doing better today in terms of life expectancy, education, and per capita GNI. In fact, let’s see what this chart looks like for life expectancy alone:
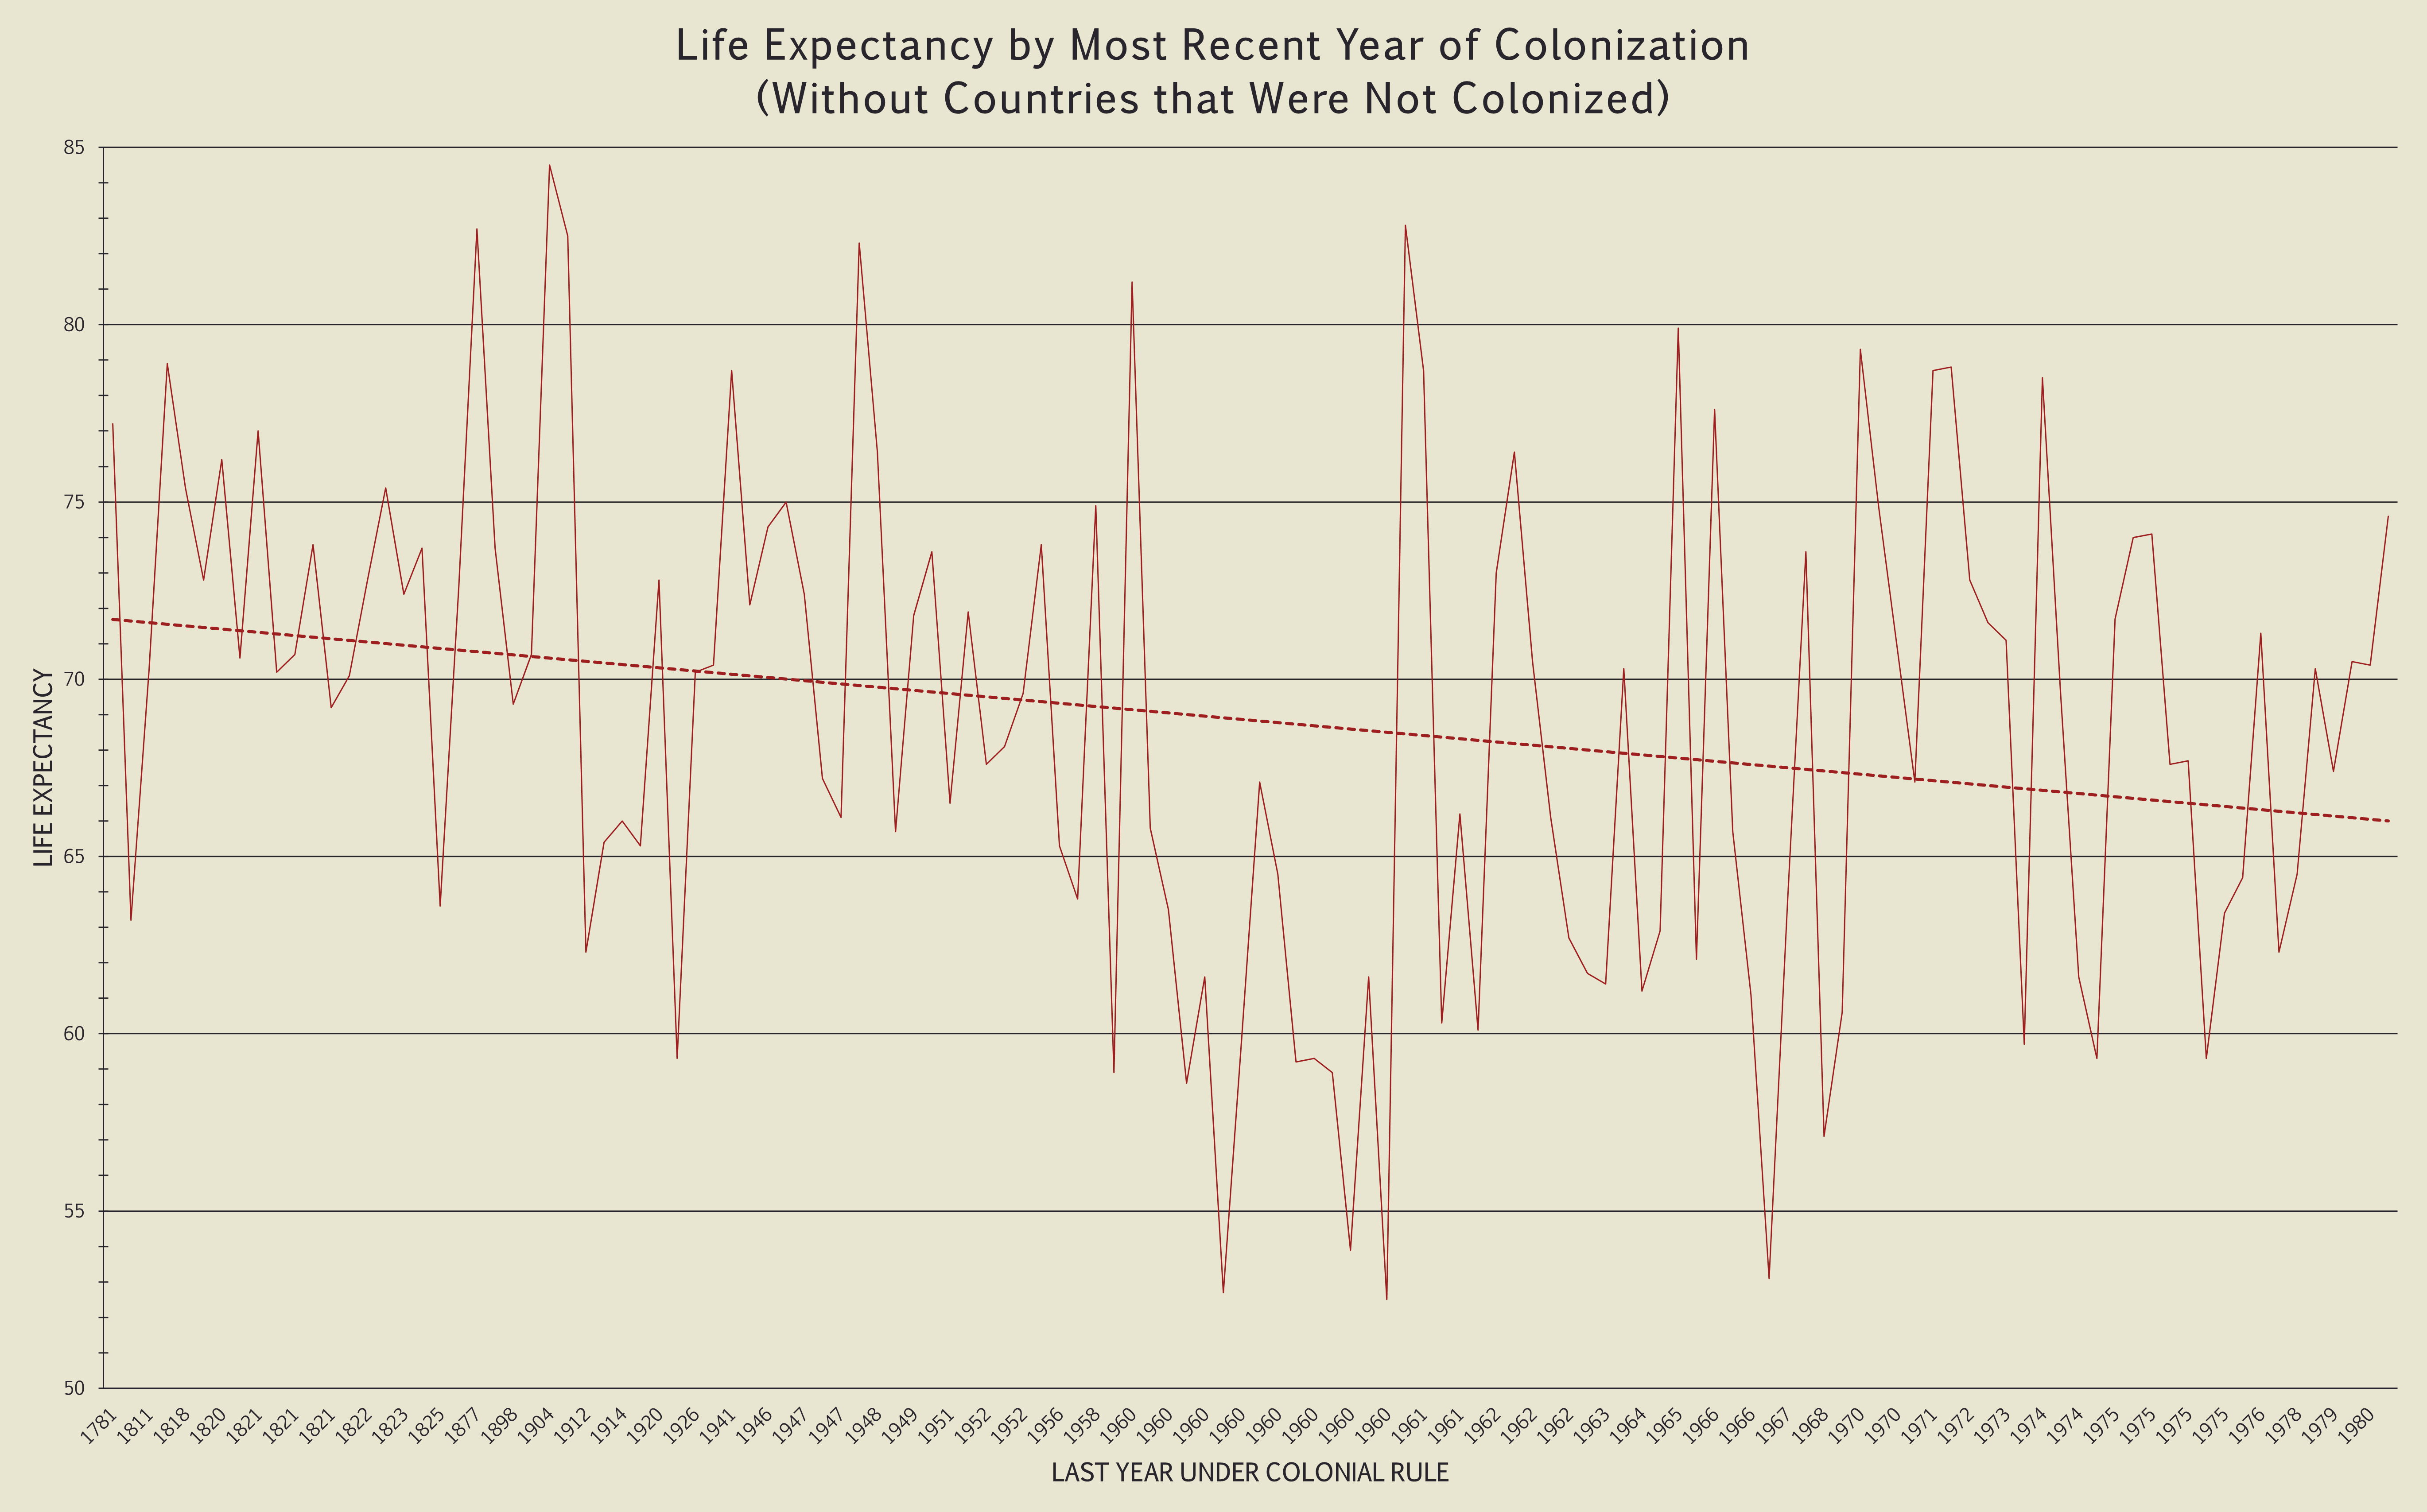
Yep. That’s kind of a big deal. All other things being equal, being born in a country that gained independence centuries ago will give you a life expectancy of over five years greater on average than being born in a country that gained independence a few decades ago. To reiterate: that is on average. The fact that the actual gap can be over 20 years of an average lifespan shows a truly horrifying degree of inequity.
Finally we can answer our first question. In fact, we can answer it twice.
Is there a relationship between HDI and colonial rule? Yes: the longer it’s been since a country was a ruled by a colonial power, the higher its HDI tends to be. And yes: very, very much so if you happen to be talking about a country that was never colonized.
So then…
How big a difference is there in HDI between countries that were colonized and countries that were not?
Big. A big difference. In a minute here, when we narrow our scope in a meaningful way, we’ll see the difference become very large indeed.
Let’s divide our countries into groups. The first group will simply be all countries, regardless of colonial status, HDI, or anything else. I’ve made that bar gold. The other two groups are countries that were colonized for 0 years (on the left) and countries that were colonized for at least 1 year (on the right).
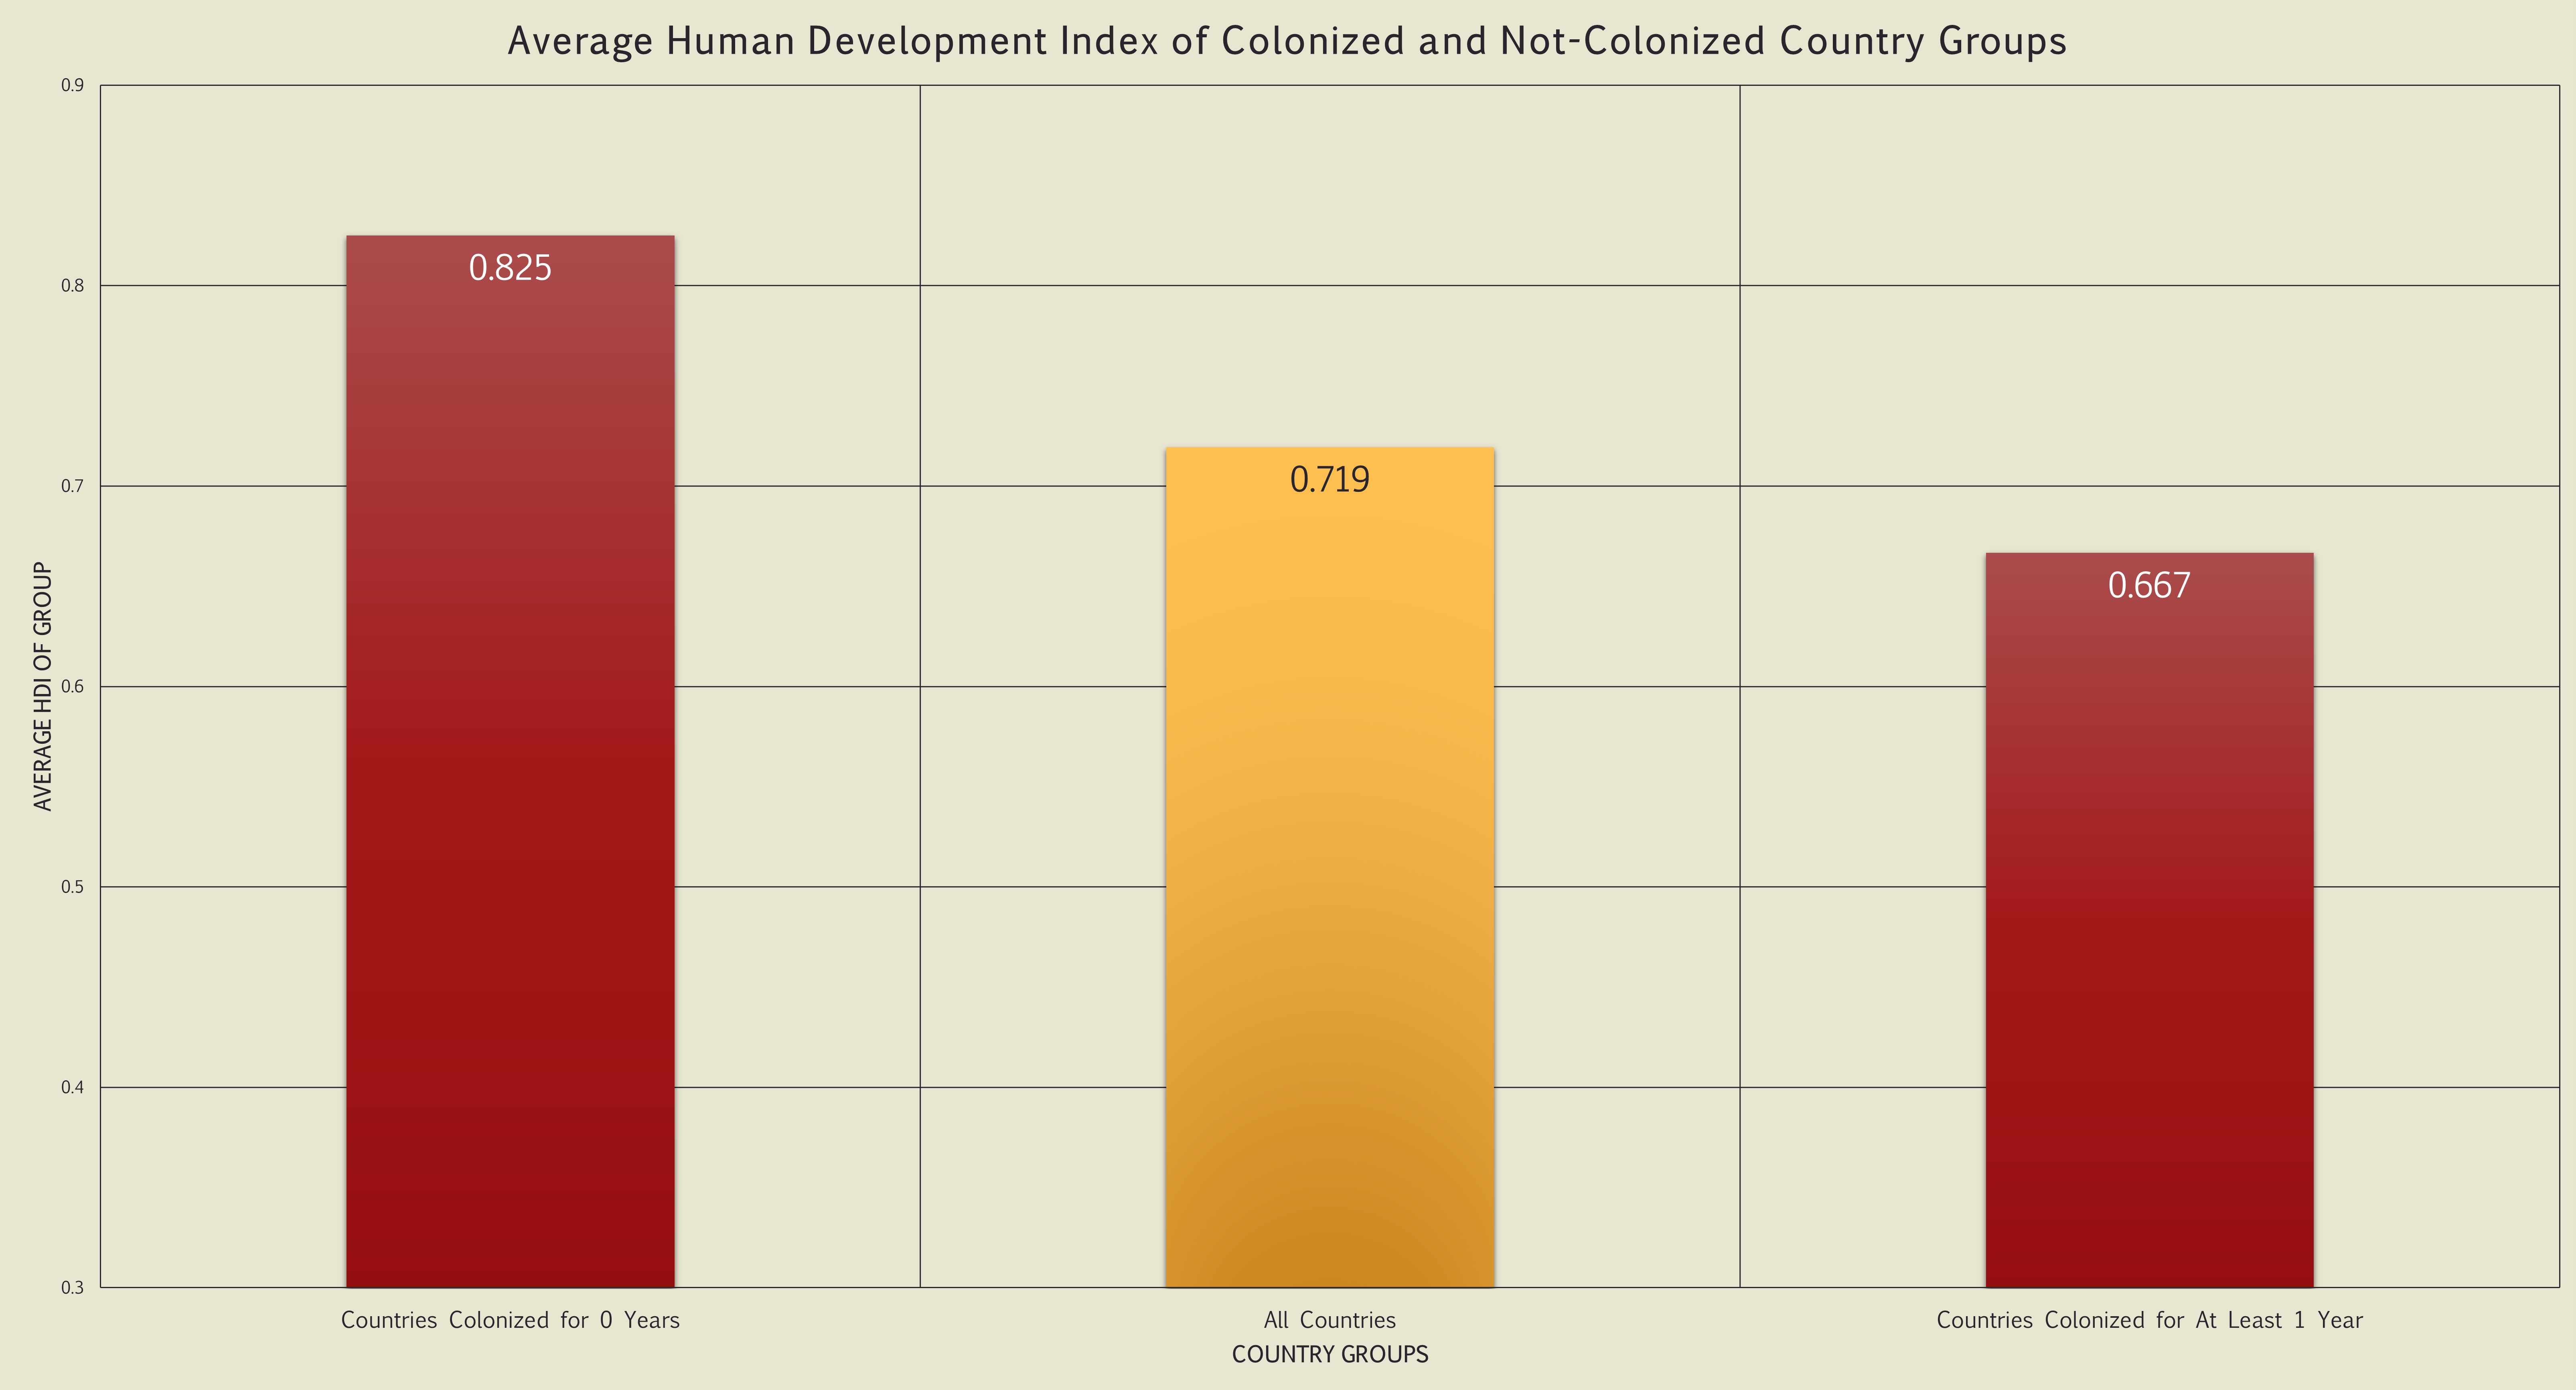
See it? If the visual isn’t impactful enough, here are some numbers. Remember as you read these that in the 2021 data, HDI ranged from 0.385 to 0.962, so these gaps are not as small as they might seem.
Countries that were never colonized have an HDI 0.106 higher than average (which is 14.7% higher). Countries that were colonized at some point have an average HDI 0.053 lower than average (7.3% lower). Comparing the separated groups directly, countries that were never colonized have an average HDI 0.158 higher (23.8% higher) than countries that were colonized.
This is a big, important answer to our question. Let’s get an even bigger and more important one — all we have to do is create a new group. Let’s call this group “Colonizer Countries,” and define it as just the eight countries in the COLDAT set that colonized other countries: Belgium, Britain, France, Germany, Italy, the Netherlands, Portugal, and Spain.
The average of all countries is still in gold.
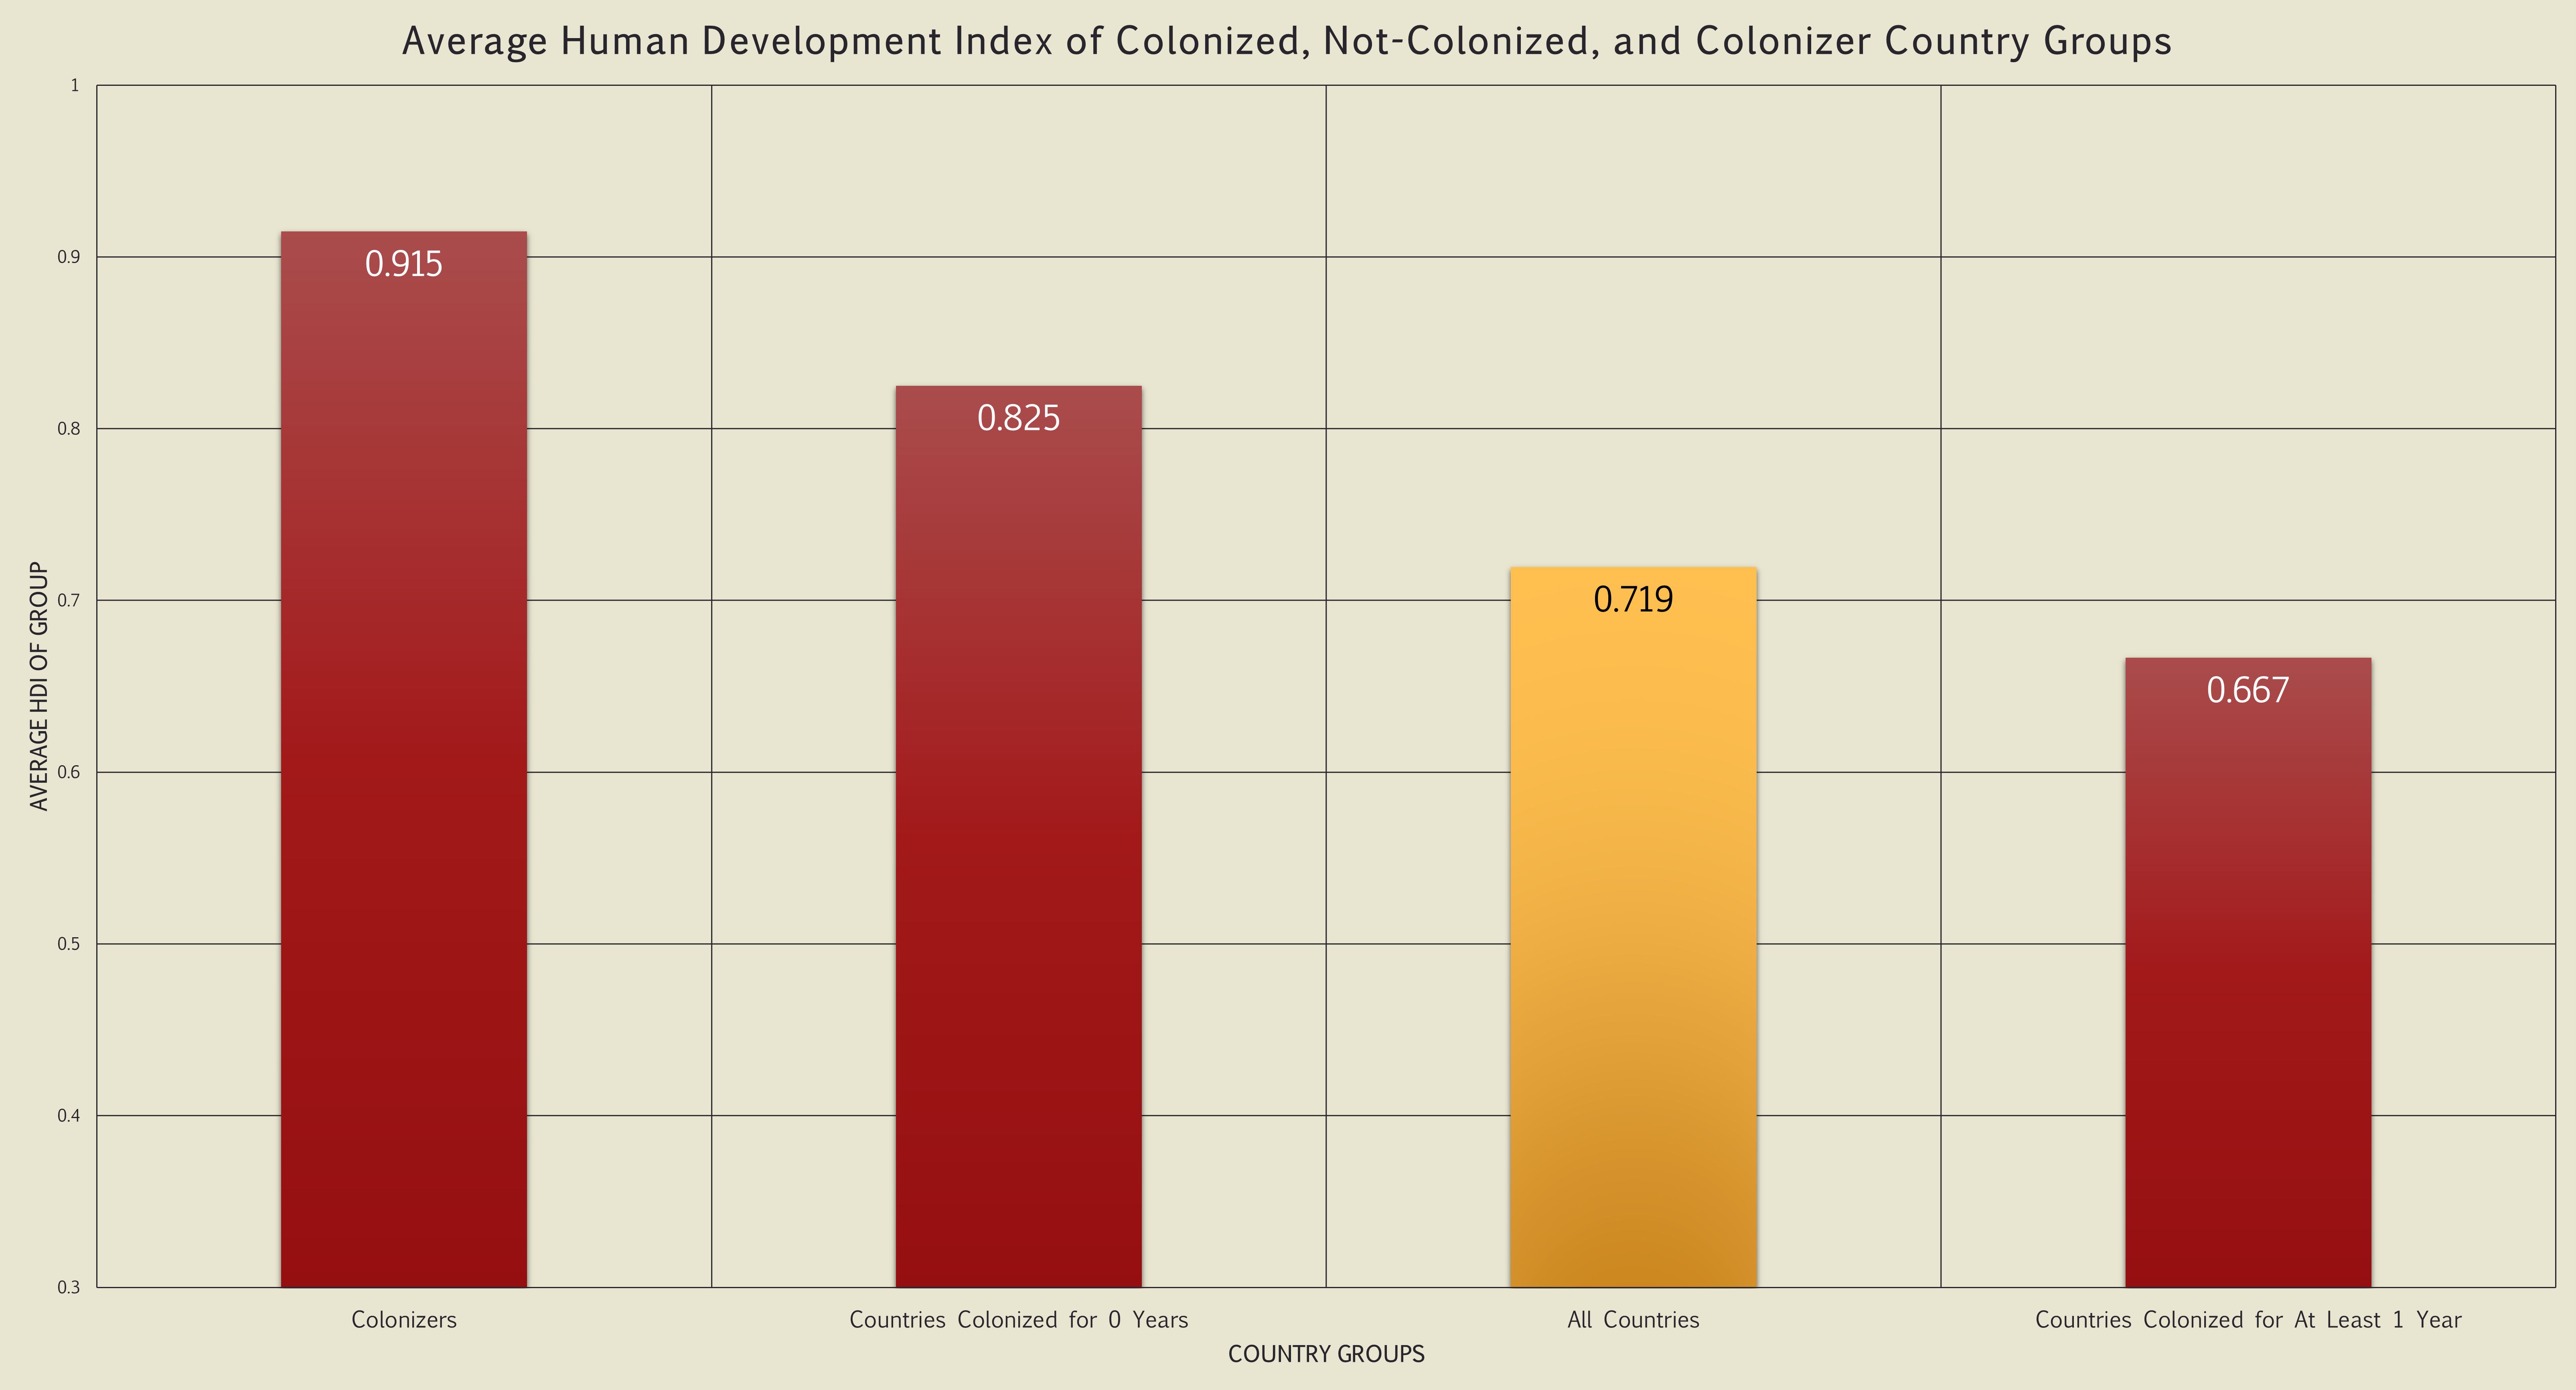
Well, there’s our story. The eight European countries that engaged in far-reaching colonization, which are used in the COLDAT set, have much higher HDI today than the other groups. When compared to all countries, the colonizer countries have an average HDI 0.195 higher (27.2% higher). Even more telling, the colonizer group has an average HDI of 0.248 higher (37.2% higher) than the group of countries they colonized.
So to reiterate the answer to this question: there is a very large difference in average HDI between country groups.
So what’s the point?
Well, the point is exactly what I think we all predicted at the beginning. It just took some digging to get to the bottom of things.
Now we can see that, on average, countries that were colonized have an HDI rating today that is lower than the global average, countries that were never colonized have an HDI rating that is above the global average, and countries that were prolific colonizers have an HDI rating today that is far above the global average.
Colonization and colonialism have had long-lasting effects. So long-lasting, in fact, that they are still very much ongoing. There’s a history podcaster and author I like who predicts that centuries from now, the period we’re living through today will be thought of by historians as the tail end of the colonial era.
Looking at our HDI and COLDAT data, it appears that those lingering effects may be detriments to the quality of life in countries that were colonized, and boons to the quality of life in countries that engaged in colonization. That said, there’s no way that I can say this data shows conclusively that there’s a causative relationship. So instead of saying that, I’ll tell you to go read some books and articles about it. It’s not like this is a big secret.
Now I feel like I’m buried under the weight of history… but at least I have a shovel.
Sources
Human Development Index. United Nations Development Programme, 2022. https://hdr.undp.org/data-center/human-development-index#/indicies/HDI
Becker, Bastian, 2019, “Colonial Dates Dataset (COLDAT)”, https://doi.org/10.7910/DVN/T9SDEW, Harvard Dataverse, V2, UNF:6:jzNFI2Xy+I9LGpEZ6G97GQ== [fileUNF]
